| CustomSim & HSPICE | |
| Christopher Labrecque, Marketing Manager for Analog & Mixed Signal made a suite presentation on CustomSim which includes circuit simulators like: HSPICE, HSIM, NanoSim and XA. Fredrik Ivarsson, Senior Corporate AE demonstrated the tools running on a laptop.Slides showed that HSPICE has sped up about 5X in the past 2 years and that with a four-core CPU you can see up to a 1.8X speed improvement. Licensing of multi-core was interesting where one HSPICE license allowed two threads, which showed about a 40% speed improvement.
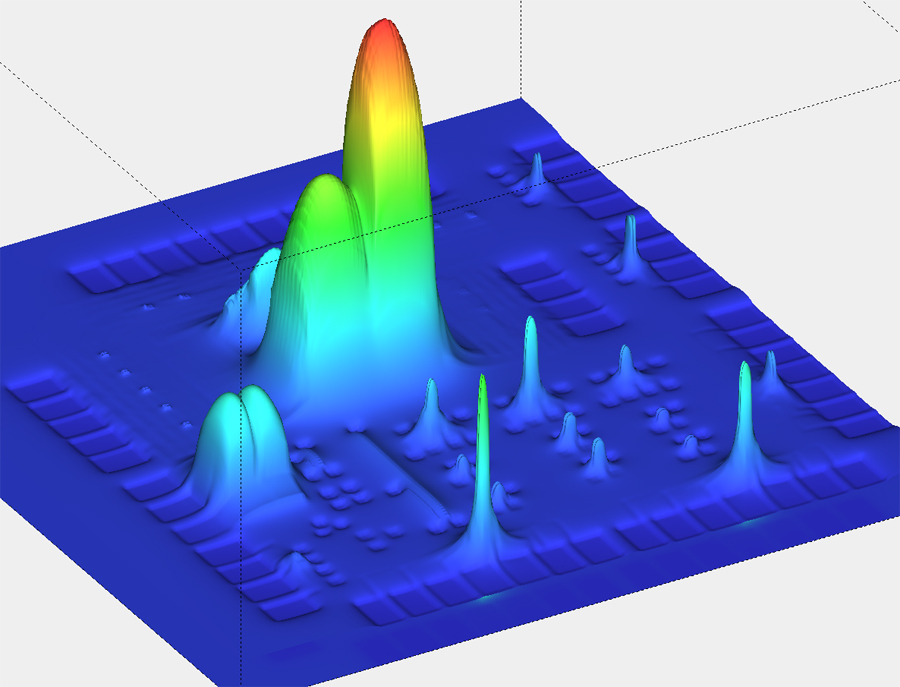
For cell characterization using HSPICE they have speed up run-times about 3X faster in the past 2 years. In the upcoming September release you can expect another 1.5X speed improvement when characterizing standard cells. Designs with 1,000 port s-parameters are now possible to simulate in HSPICE, making signal integrity engineers happier. A new analysis option called .stateye is used to automate BER simulations with 1,000X faster run times and 10,000X less data compared to full monte-carlo simulations. Synopsys offers lots of circuit simulation tools, probably too many. XA was launched last year and can be 10X to 200X faster than HSPICE, and 10X to 100X faster than HSIM or NanoSim. The only downside to XA is that it has fewer features and options than Nanosim, HSIM or HSPICE. There are no plans to end-of-life HSIM or Nanosim. Most EDA companies would opt to transition users off old simulation technology and onto new technology within several quarters. It was cool to see how dynamic IR drop values from circuit simulation could be seen on the IC layout using the layout editor of CustomDesigner. XA can simulate with VCS about 12X faster than HSIM/VCS or Nanosim/VCS. The popular viewer from Sandworks is now named Custom WaveViewer and it offers fast pan-zoom, multi-gigabyte file loading, supports 48 waveform formats, and only takes a few clicks to access any command. Inside the schematic and layout tools (Custom Designer) you can quickly launch circuit simulation jobs and view the results with WaveViewer. In the demo we saw WaveViewer display: Smith Charts, Frequency results, log scales, harmonic balance values and even 3D graphs. CAD groups will love the command-line scripting with Tcl. |
 Christopher Labrecque
Fredrik Ivarsson |

Related Posts

DesignCon 2011
I’ll be attending DesignCon on Monday and Tuesday, intending to visit the following companies to get an update on their EDA tools: Synopsys – HSPICE…

Faster IC Designs Without Using a Clock and With Delay Insensitive Results
Digital designers are taught on day one that they must use synchronous logic design which employ a clock to synchronize all events in their IC…
Thermal Analysis for IC Designs
Ed Cheng, CEO at Gradient Design Automation recently spoke with me about his unique company focused on thermal analysis of IC designs. I first met…