The following information is supplied by EDAC and shows an increase in total revenues of 4.6% in Q1, 2010. Remember that this includes IP plus EDA tools.
Each quarter, the EDA Consortium publishes the Market Statistics Service (MSS) report containing detailed revenue data for the EDA industry. The report compiles data submitted confidentially by both public and private EDA companies into tables and charts listing the data by both EDA category and geographic region. This newsletter highlights the results for the first quarter of 2010. Additional details are available in the press release, or by subscribing to the EDA Consortium MSS report .
Overall, first quarter 2010 EDA revenues increased 4.6% compared to the same period in 2009. Total revenue for Q1 was $1247 million. Figures 1 and 2, below, summarize the revenue growth for Q1 2010 compared to Q1 2009, detailed by category (figure 1) and geographic region (figure 2). The MSS report contains many additional sub-categories, allowing subscribers to perform a more detailed analysis of revenues affecting their business. A complete list of categories for 2010 is available here.


Tables 1 and 2, below, show the percentage growth for the EDA industry by major category and region. (Negative growth is listed in parentheses).
| Category | Revenue ($ Millions) | % Change |
| CAE | 458.5 | 7.2 |
| IC Physical Design & Verification | 274.4 | (9.2) |
| PCB & MCM | 109.4 | (8.8) |
| SIP | 320.9 | 35.8 |
| Services | 83.7 | (20.7) |
| Region | Revenue ($ Millions) | % Change |
| Americas | 492.9 | (0.2) |
| EMEA | 224.2 | 0.5 |
| Japan | 250.8 | (1.9) |
| APAC | 279.0 | 33.2 |
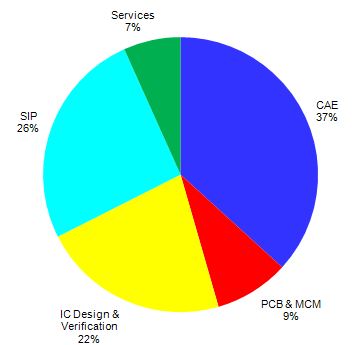
Figure3 (below) shows the EDA revenue percentages by major category. As the chart shows, CAE remains the largest category, followed by Semiconductor IP and IC Design and Verification tools. Geographically, the Americas is the largest consumer of EDA tools, with the remainder fairly closely divided amongst Europe, Middle East, and Africa (EMEA), Japan, and Asia Pacific (APAC), as shown in Figure 4.


Figure 5 shows the historical EDA revenue for the major categories (CAE, PCB & MCM, IC Physical Design and Verification, SIP and Services) from Q1 2006 through Q1 2010. Each quarter’s MSS report contains data for the current year as well as the previous 3 years quarterly data in both tabular and graphical formats.
Data is reported confidentially to an independent accounting firm, which allows both public and private companies to report revenue data by detailed category. Individual company data is not reported, and steps are taken to further protect individual data for categories with a small number of reporting companies. Contributing data is free, and contributors will receive the quarterly MSS executive summary report. The full report is available via subscription, and contains substantially more detailed information for EDA revenues by category and region, providing the information subscribers need to analyze trends in EDA.
For more information on the MSS report, including information on subscribing to the report and the benefits of joining the EDA Consortium, please visit the EDAC web site , or email mss10@edac.org. The information supplied by the EDA Consortium is believed to be accurate and reliable, but the EDA Consortium assumes no responsibility for any errors that may appear in this document.


Hi Daniel,
Thank you for sharing the EDA report. The two most interesting statistics that stands out most for me is 1) that the front end of design is showing the most revenue growth both in design creation and IP used in design and 2) the increase year over year in the APAC region when most other regions are flat. It would be interesting to see which tools represent the growth in the APAC region as a follow-on post if you can get the data.
The front-end of design growth makes sense to me because designs across the board are more complex. I see this in our are of focus, in the FPGA market. Xilinx and Altera are delivering design platforms that enable Systems on Programmable Chips. There is a significant design tool opportunity brewing in the FPGA verification space and we are excited to be part of it.
Dave,
EDAC does have growth by region and tool category however you have to buy their report or join the organization.
When I worked at EDA companies they would often radically change the product category each quarter, so it makes it a challenge to track any category with confidence. EDAC does not enforce consistency or check why a product is in any category. If EDAC had more teeth for enforcing product categories then it would make their reports more reliable.
I could place all the EDA tools in the proper revenue categories…